
Storefront Safety Initiative

Our research

Source data for a risk that is still undercounted

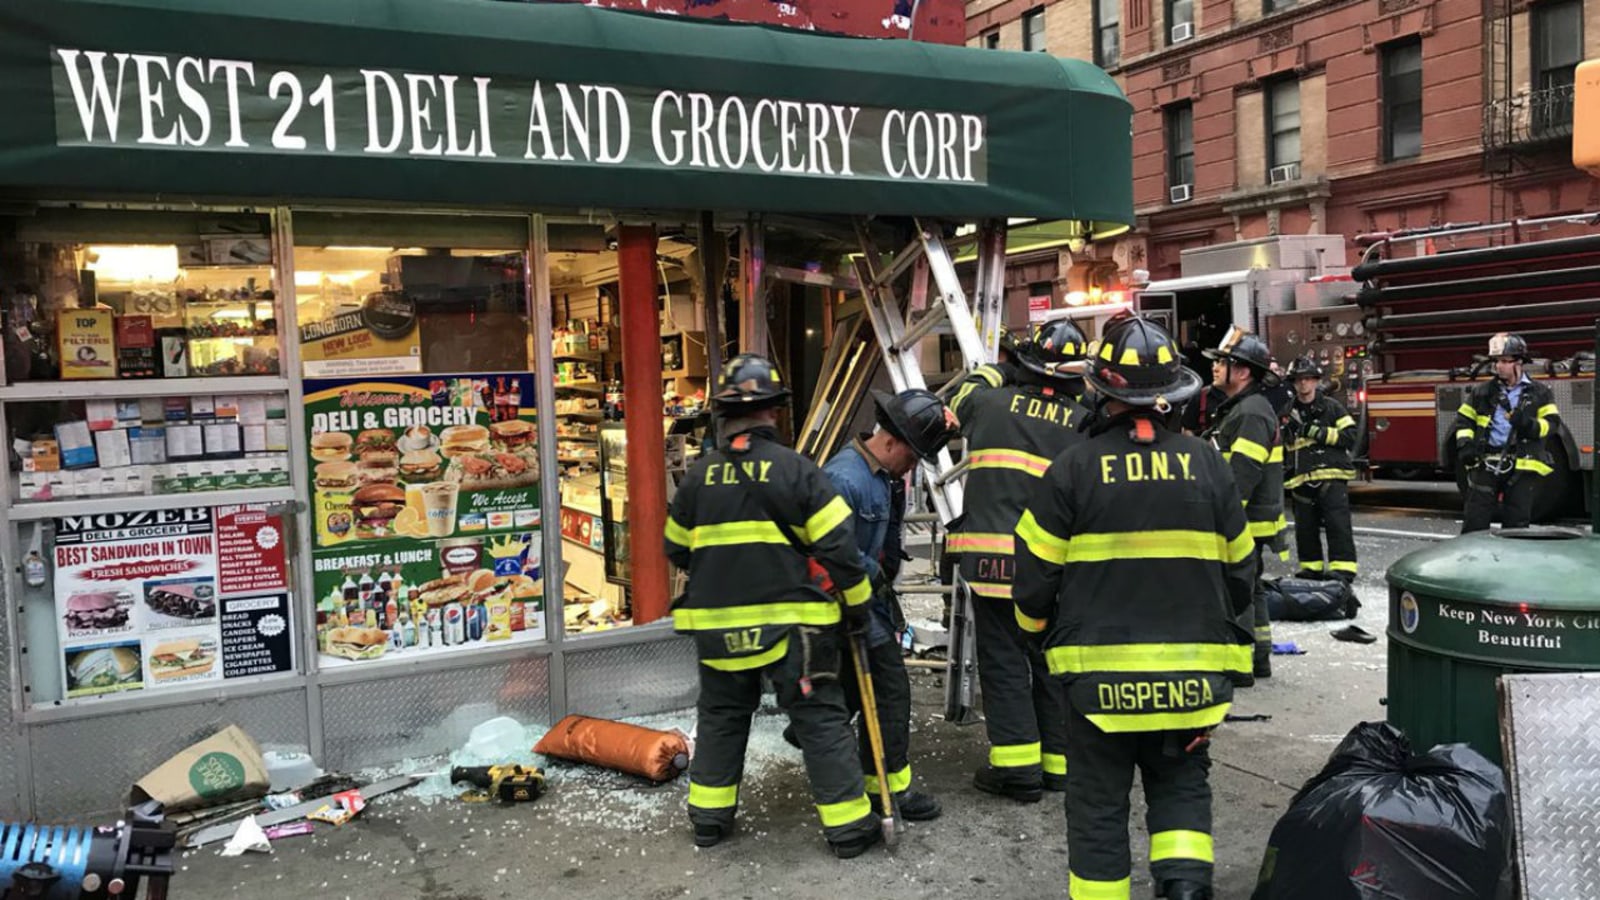
Each year in the United States, as many as 16,000 people are injured and as many as 2,600 are killed in vehicle-into-building crashes.

100+

Storefront crashes occur every day in the U.S.

46%

Of storefront crashes result in an injury

8%

Of storefront crashes result in a fatality

1 in 12

Conservative estimate of incidents captured in SSC data (Lloyd's review)

Last updated

Distribution

How the incidents break down

Driver age

100%

Locations

100%

Causes

100%

Validation

Treated as source data by risk managers

In March 2023, the Storefront Safety Council completed an exchange of data and methodologies with CHC Global, an independent London-based risk management company connected to Lloyd's of London.

Lloyd's found the Council's data valid and credible, concluding that, given the lack of other private-property datasets, the SSC collection should be treated as source data for researchers and risk managers. Even then, the database reflects only a fraction of daily incidents.

Visit the Storefront Safety Council →

How the research grew

A decade of building the evidence base

What the Storefront Safety Council has tracked since 2014, and how the dataset expanded.

  1. 2014

    From 2014 onwards, we have collected data on:

    • Stated and available causes of storefront and similar crashes
    • Ages of drivers of vehicles involved in storefront and vehicle-into-building crashes
    • Category of buildings and businesses struck in vehicle-into-building crashes for each state, ranked against each state's percentage of licensed drivers in the U.S.
  2. 2016

    We expanded our research to analyze the same data listed above and began collecting additional information found to be statistically significant, including:

    • Names of locations hit by vehicles if applicable (e.g. "Starbucks")
    • Number and name of brand/chain store locations hit by vehicles
    • Statistically significant causes previously captured as "other," including vehicular assault, reckless driving, falling asleep at the wheel, weather conditions, speeding, mechanical failure, driver distractions, and driver errors like pedal misapplications
    • Statistically significant site types previously captured as "other," including bus stops, child and elder care facilities, schools (K-12), churches, medical facilities, government buildings, gas stations, banks, and hair and nail salons
  3. 2020-2021

    Collection expanded again to capture emerging risk patterns:

    • Vehicle-into-pedestrian incidents in commercial parking areas
    • Outdoor dining and plaza exposure tied to vehicle encroachment
    • Audits identifying employee injuries and fatalities for insurers and federal partners
    • Continued refinement of causes, locations, and site types for research and risk management use

Key findings

What the data makes clear

100+

Storefront crashes occur more than 100 times per day.

46%

Of storefront crashes result in an injury.

8%

Of storefront crashes result in a fatality.

16,000

People injured each year in vehicle-into-building crashes.

2,600

People killed each year in these crashes.

24%

Of incidents happen in retail stores.

Contact SSI at 909-964-2906 or rob.reiter.pp@gmail.com to discuss data access for research or risk management purposes.

Request data access